Email Benchmark Stats Across Industries for Early 2022
- 0.5
- 1
- 1.25
- 1.5
- 1.75
- 2
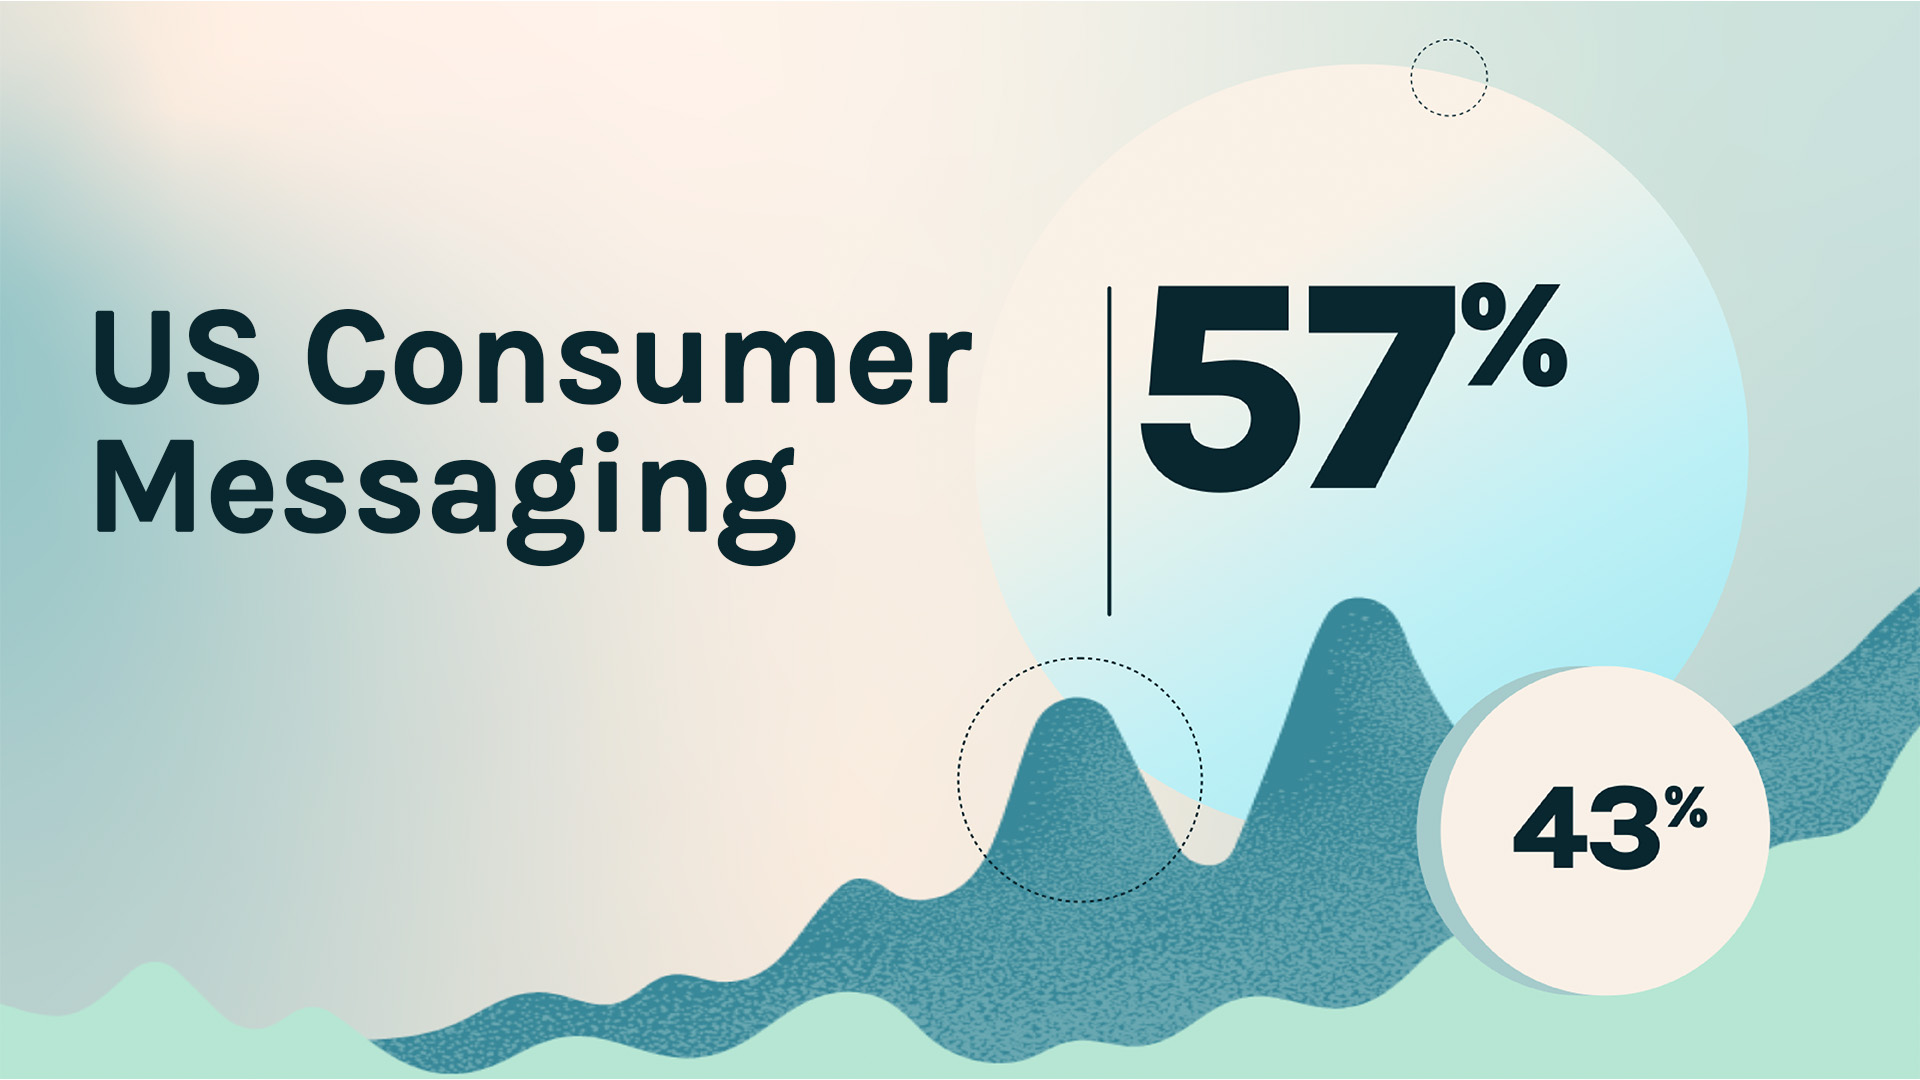
Tim Glomb: Email, benchmarking. Where do you stack up with the rest of your industry? We're going to share some of our email benchmarks from early 2022 across the Cheetah Digital Enterprise global brand client. So, stay tuned. I'm Tim Glomb, the VP of Content here at Cheetah Digital and host of Thinking Caps, the podcast where we toss on some hats and talk about the future of marketing. And today I'm going to talk about some email benchmark stats for early 2022 across the Cheetah Digital global enterprise client list. And here at Cheetah Digital, we are all about email. It's been in our DNA for decades. We send billions of email messages for our clients each year. I was lucky enough to get my hands on our internal email benchmarks report so far for early 2022, as compiled by our strategic services team. Now, email performance by itself is not necessarily a compelling story. We built our customer engagement platform to help our enterprise brand clients across the entire life cycle of relationship marketing. Those stages include acquiring an audience, understanding them as individuals, engaging them across multiple channels and then retaining them and making them brand advocates. Now, of course, messaging is a huge factor, smack dab, in that engagement stage. But for today, I just want to share some basic email stats that, you, our marketer audience, can benchmark against for your own performance. Now, this report details the email marketing trends in early 2022 and it's based on the success of Cheetah Digital clients. I'll give you some caveats before I begin here. Apple's iOS 15, it continues to muddy the stats specifically around open rates. Can't get around that. And this is a ubiquitous problem. It's an issue that all email service providers have. It's not just isolated to Cheetah Digital's platform. So, I'm going to focus more on engagement metrics we have across our client campaigns here. This has always been the stronger KPI to follow regardless of open rates and disruption like iOS 15, which is sending false positives for opens. Of course, we want to see large open rates. Don't get me wrong but engagement rates are really what tell the story here. Your chief financial officer, they don't care how many people opened an email, especially if those people didn't take an action or convert to a sale or some other meaningful action. So, remember we have tons of email and messaging best practices, all sorts of resources available at www.cheetahdigital. com. But let's dig in here. I want to start with some stats in North America, across all industries. These are all industries. The delivery rate for Cheetah Digital clients was 98.69% average. Now, clearly that's a great statistic and it's a huge testament to our deliverability team here at Cheetah Digital. Now, when we look at click rates across all industries, the average was a 3. 67% click rate. Now, again, this is across a giant pile of emails. Some of those are transactional. Some are triggered emails by audience taking actions. And some of them are just downright campaign driven when a marketer just sends out an email to a huge segment. The unique click rate across all industries was 2. 31%. This may seem low, but again, these are across all emails, all industries and all campaign types. Unsubscribe rates across all was a mere 0.1%. So, now that we've got the generalized numbers out of the way, let's look at specific industry performance. And I'm going to start with the finance and industry categories in North America, commonly referred to here as the fin serve industries. Deliverability was strong with a 98.83% delivered. Total clicks came in at 4. 26% with unique click rate of 2. 85%. These both share a 5% increase year- over- year for that category. And the fin serve on subscription rates were also at 0. 1%, which was the average across all. Now, statistics for media and publishing in North America are as follows: 98.53% deliverability with 3. 76% total clicks and 2. 16% unique click rate. The unsubscribed rate for media publishing was 0. 05%, which is very low. It's half of the industry average. So, doing well there. In the restaurant category for North America, this year the deliverability was incredibly high and it was at 99.18% but total clicks were only 0. 9% and unique clicks only 0. 63%. Unsubscribed rates were 0. 08%, which is below the average. Now, there's a lot of maturity that we're going to discuss in upcoming webinars around the restaurant space and how loyalty plus email and messaging is really the key to engagement. You got to have both. They can't live independently. Cast and blast emails are far less effective these days, post pandemic, and understanding your audience while delivering both emotional and transactional loyalty offerings has outperformed almost all benchmarks we've seen. So, I'm looking forward to that webinar and more data coming on there. So, stay tuned. Keep tuning into Thinking Caps and keep checking www. cheetahdigital. com where you can dig into the restaurant and industry with us. All right, moving along in the retail industry for North America, the delivery rate was 98.5% with total clicks of 3. 31%, which is an 11% lift year- over- year. And the unique rate was 2. 06% for unique clicks. And that was a 14% lift year- over- year. Unsubscribed rates were 0. 08%, which is a drop of 37% year- over- year. The transaction to click ratio for retail was 2. 5% so far this year, and that's a 32% increase year- over- year for this time period. Now, this is attributed to many of our clients, again, having a robust loyalty program as well as more personalization in their messaging. Looking at the stats from any given channel like email on its own is not the full story. It's also worth noting that the average order value for clients so far this year is$ 231, which is a 10% increase year- over- year. This is a true testament to the adoption of our customer engagement platform for these retail clients and stronger relationship marketing strategies. And that's putting messaging squarely in the middle of their acquisition and retention efforts, right there in the engagement layer. So, if you want to dig into how Cheetah Digital delivers this value across all industries for our enterprise global brands, get to our resources section on our website at www. cheetahdigital. com. Go there, download the Path to Personalization white paper, which also has an accompanying webinar. That was something we published with that age. Now, also get our zero party data playbook and some of our more recent blogs from our product marketing team really explain the four stages of relationship marketing in multiple use case scenarios. In fact, I think they have eight use case solutions that you can really dig into that will resonate with your brand. I don't care what your industry is. Now, this content is invaluable, in my opinion, as you try and refine or build your own relationship marketing efforts. With that said, we love retail. We love restaurant. I had to give them a little extra love. Let's move to travel and hospitality, which we also love. Those industries saw a 98.99% deliverability rate. Crazy. We also saw a 4. 42% click rate with a 2. 77% unique click rate, which for 40% and 51% respectively year- over- year increases. Unsubscribe rates are right around the industry average at 0. 09%. Now, let's look at device information. Across all industries, 57% of emails were consumed on a mobile device with 43% on a desktop or web mail. Now, here's a deeper breakdown. I got a little chart for you on all the devices across all industries. So, you can find yours very quickly and compare that to your own results so far this year. All right. Well, to close out, again, I just want to stress, this should just be one data point. This is one data point for benchmarking against your own efforts and you really should be considering how strong is your omnichannel approach? How does messaging tie into acquisition, retention, et cetera? These numbers are not necessarily good or bad but reflect aggregate benchmarking. If you'd like to learn how we can put our platform to work for you to deliver a full life cycle marketing solution, well beyond the typical messaging KPIs, just give us a shout. We'll talk about it. We'd love to show you how we view the four stages of relationship marketing, how we serve that and how our platform and strategic services team could help you. So, I'll see you next time on Thinking Caps. As always, please subscribe on Apple, Spotify and other podcasting platforms. Check us out on LinkedIn and you can get those things directly when they're published. So, I will see you next time. Peace out.
DESCRIPTION
Email is one of the most impactful channels used in relationship marketing. When viewing email's impact with other channels you can get a great overview of your impact on audience action. In this short episode we reveal some of thew North American email benchmarks across Cheetah Digital's enterprise client base.
Today's Host

Tim Glomb
Today's Guests

Tim Glomb
Recent Episodes
Jesse Redniss: Putting Performance Privacy to Work for Your Brand
Episode 90 | 05.31.2022
Top US Consumer Messaging Trends Broken Down By Age
Episode 88 | 05.06.2022
Top Consumer Trends for Finserve to Capitalize on ASAP
Episode 87 | 05.02.2022
Consumers' Biggest Frustrations With Brand Messaging Today
Episode 86 | 05.02.2022
Why Email is #1 Channel for Revenue in US... Again.
Episode 85 | 04.29.2022

Trending Now: Earth To Marketers, Campaigns About Preserving The Planet Stand Out
Episode 84 | 04.15.2022